How to Evaluate Product-Market Fit and Unit Economics Before Fundraising
Swipe. Tap. Insert. Click. That was you transacting with your credit card just now. With 40+ billion transactions in the US annually1, it’s clear that customer transaction data is extremely valuable. Properly analyzed, transaction data tells the story of a company’s growth trajectory in a way nothing else can. It uncovers the who, what, when, and where of your top-line, allowing you to learn more about your customer’s why and understand your product-market fit and unit economics before fundraising.
At Hum, we help companies dig into their customer transaction data to help provide a clear picture of their company’s growth as they embark on their fundraising journey. And thanks to our funding platform, the Intelligent Marketplace, customer analytics are easily produced by connecting their business systems such as Stripe, Shopify, Braintree, etc., to the platform. In part 1 of our 3-part series, we identify the 5 types of customer transaction analytics to gather and understand prior to raising capital from investors.
What is customer transaction data?
Digitally native businesses such as direct-to-consumer brands (DTC), marketplaces, SaaS, ecommerce etc. make money through transactions. A table of these transactions with certain minimal information such as transaction date, customer ID, and value of each transaction is referred to as customer transaction data (sometimes also called the “customer tape”). This analysis is usually captured within the company’s payment processing system such as Shopify, Braintree, Stripe, and PayPal, etc.
One of the most widely used ecommerce dataset is available in The UCI Machine Learning Repository. This dataset contains actual transactions from 2010-2011 for a UK-based registered online retailer. The dataset is maintained on their site, where it can be found by the title “Online Retail.” A snapshot of the dataset is provided below:
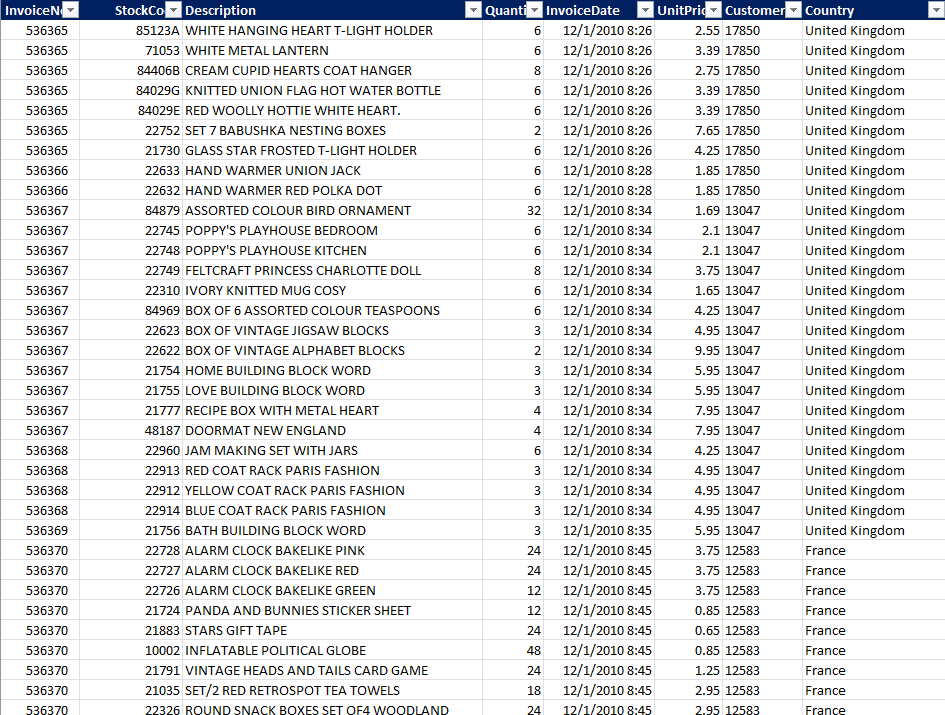
While this dataset contains SKU level information, for most of the customer analysis we are reviewing, an invoice level summary is sufficient.
What can you do with this data to help tell your company’s growth story when starting to fundraise?
Customer acquisition strategy is a long term investment and businesses need to make this investment prior to being able to generate revenue from customers. Given this latency, wherein customers are acquired upfront and the payout happens over a period in time, management teams can find it difficult to communicate their story to investors using just financial statements. Financial statements are by nature backward looking, which do not act as a leading indicator, especially in the early stages of a company. By analyzing the customer transaction data, companies can articulate their growth story and path to profitability more clearly. In our next blog in this series, we will walk through this data in detail and illustrate how it can help tell a more compelling story to investors when fundraising.
Which are the 5 most important customer transaction analyses to perform as you prepare to fundraise?
1. Growth attribution
You can think about growth from the perspective of your customers and their spend:
- Existing customers – They can be further classified into Continuing and Resurrected customers.
- Continuing – are existing customers who transacted in the previous period. Their spend can be further classified into the following:
- Retained – spend that was retained from the prior period. For example, if customer A spent $100 in the previous period, and $80 in the current period then $80 would be retained. Whereas if customer B were to spend $100 in the previous period, and $120 in the current period then $100 would be retained.
- Expansion – increased spend in the current period in comparison to the prior period. In the example above, customer A’s expansion amount would be $0 while customer B’s expansion amount would be $20.
- Contraction – reduced spend in the current period in comparison to the prior period. In the example above, customer A’s contraction amount would be $20 while customer B’s contraction amount would be $0.
- Churned – transacted in the prior period but not in the current period.
- Resurrected – Existing customers who did not transact in the prior period. Please note that resurrected customers would have been counted as churned in a prior period.
- Continuing – are existing customers who transacted in the previous period. Their spend can be further classified into the following:
- New customers – customers who transacted for the first time in the current period.
This framework gives you a very detailed growth attribution.
Current period’s gross transaction value = New + Retained + Expansion + Resurrected
Previous period’s gross transaction value = Retained + Contraction + Churned
You can use this framework for a variety of customer level attributes such as number of customers, transaction value, and number of transactions. In addition to disaggregating the metrics, the following ratios can help you better understand your company’s historical growth:
- Gross retention: Reflects the percentage of the previous period’s transaction value that was retained. Please note that if any customer spent more in the current period relative to the previous period, it would not show up in this calculation.
- Net retention: Reflects the ability to retain and expand existing customers’ spend, net of churned customers’ spend.
- Net churn: Reflects the churned transaction value after adjusting for gains from existing customers.
- Gain to loss ratio: Measures the ability of the company to capture an increased spend from existing customers in relation to the customers spend that was lost.
While each of these ratios individually are not always meaningful, they can be combined to better understand your company’s growth dynamics.
Completing this analysis will help you answer some key questions from investors that typically arise during the fundraising process:
1. How is your growth trending?
2. What % of growth is driven by an increase in the number of customers?
3. What % of growth is driven by new customers?
4. What is the net retention?
5. What is the churn rate?
You can see an example growth attribution chart from Hum’s Intelligent Capital Market fundraising platform below:
2. Cohort analysis
While growth attribution explains growth at an aggregate level of analysis, cohort analysis lets you get granular by looking at narrower groupings of customers. A cohort can be defined in multiple ways, but one common method is to define cohorts based on the period in which the customer was acquired. While individual customers are highly heterogeneous, what we have found is that cohorts show patterns useful for companies to understand customer spending behavior. Understanding how a group of customers interact with a product/service is very helpful in understanding product-market fit. In this analysis we would approximate your customers’ interaction with your product/service using their spending pattern.
Each cohort’s aggregate transaction value retention and cumulative transaction value per customer are typically evaluated to better understand how a group of customers behave.
Completing this analysis will help you answer some key questions from investors that typically arise during the fundraising process:
1. What % of customers are active after 3/6/12/24 months since their acquisition?
2. How much does an average customer spend during their lifetime?
3. Are the newer customers spending more in comparison to older customers?
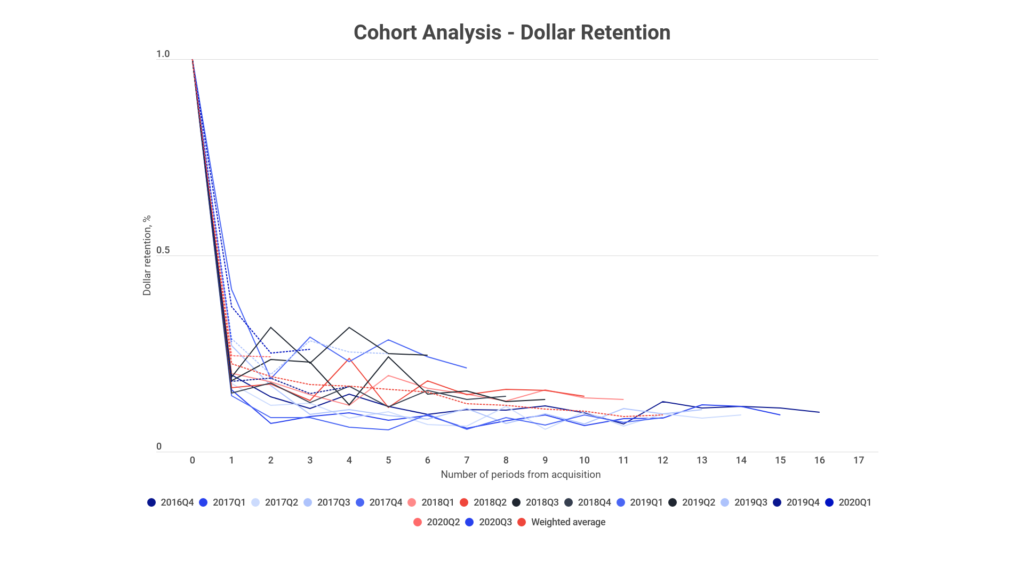
You can see an example cohort analysis chart from Hum’s Intelligent Capital Market fundraising platform below:
3. Customer heterogeneity
The next set of customer transaction analysis digs a little deeper to better understand and appreciate the diversification of your customers. The core concept to understand here is that there is no one “typical” customer and understanding the distribution of customers will help understand the diversification of your customers and how that contributes to the overall transaction volume and value.
Completing this analysis will help you answer some key questions from investors that typically arise during the fundraising process:
1. What is your concentration risk and is it trending down?
2. How much does a median customer spend during a particular period? How do your top customers spend during a period?
3. What % of customers contribute to 25%/50%/75% of your gross transaction value?
4. How often do your customers transact during a given period?
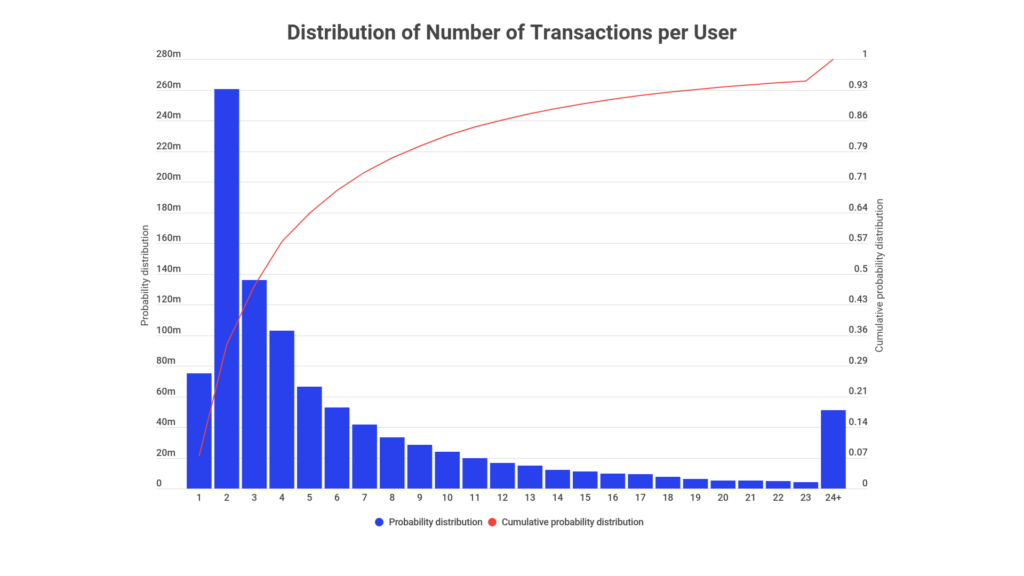
You can see an example customer heterogeneity chart from Hum’s Intelligent Capital Market fundraising platform below:
4. Unit economics
Up to this point, the metrics we’ve outlined have focused on understanding the dynamics of customer behavior with respect to the company’s product/service. While understanding the dynamics of customer behavior helps you develop intuition regarding your product-market fit, it does not provide any insights into profitability. In this section, we focus on helping you understand the profitability of your company’s go-to-market (GTM) engine.
Few definitions to note before we can dive into certain analytics:
- Gross profit per customer = Gross margin * customer’s contribution to revenue
- Customer acquisition cost (CAC) = sales and marketing spend / number of customers acquired
- Contribution profit per customer = Gross profit per customer – CAC
Understanding how gross profit per customer, contribution profit per customer, and gross profit per customer to CAC evolves over time within cohorts will provide an intricate understanding of the unit level profitability of a business.
Completing this analysis will help you answer some key questions from investors that typically arise during the fundraising process:
1. How much gross profit does a customer contribute during their lifetime?
2. How much contribution profit does a customer contribute during their lifetime?
3. What is your CAC and how is it trending?
4. What is your LTV/CAC?
5. What is your CAC breakeven?
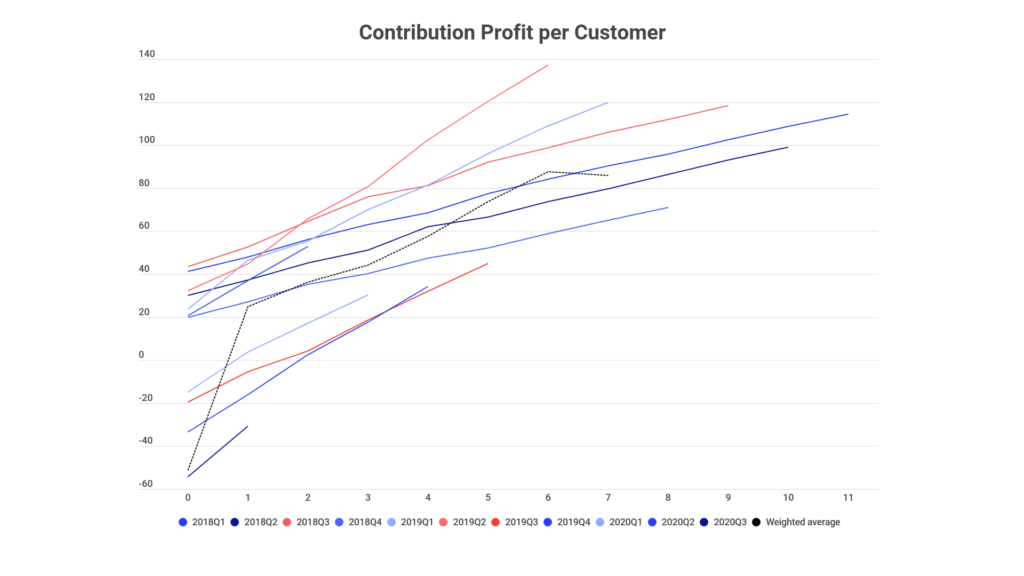
You can see an example unit economics chart from Hum’s Intelligent Capital Market fundraising platform below:
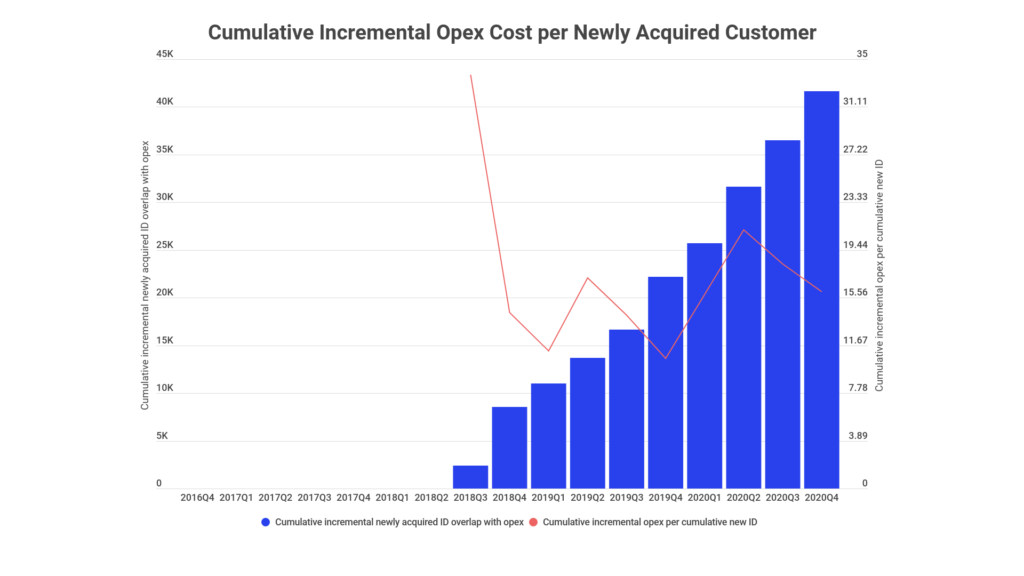
5. Cost of enabling unit economics
Any go-to-market engine requires incurring costs additional to the baseline cost of goods sold and sales and marketing spend. Analyzing those operating expenses can help you understand and explain operating leverage at an unit level. While this is seldom of high importance during a company’s early stages, it becomes more and more important as a business grows.
You can see an example cost of enabling unit economics chart from Hum’s Intelligent Capital Market fundraising platform below:
Why are these analyses difficult to do?
Each Microsoft Excel sheet can hold up to 2 million rows of data. At that scale, Excel’s performance can drop significantly and thus be highly susceptible to crashing. Many consumer facing businesses record millions of transactions per year, making it extremely difficult to analyze the data entirely in Excel.
Software choices aside, another harsh reality exists: no rulebook exists today to help management/investors understand their customer transaction data. Everyone knows that accounting ledger data is important, but without synthesizing the data into Income Statement, Balance Sheet, and Cash Flow statements, the ledger data in itself is not useful to most users. At Hum Capital, we have devised a standardized set of analytics that can help companies better visualize their customer transaction data and thereby better understand customer behavior.
Stay tuned for our next blog that will help you understand these 5 types of customer transaction analysis in greater detail to evaluate your product-market fit, unit economics, and showcase your growth story to potential investors in a data driven way when fundraising.